In this post I’m sharing the tools and tricks I use when I’m debugging. I think that knowing tools/tricks is good, but the same way that knowing how to use Visual Studio doesn’t make you a good programmer, knowing that certain tool exist won’t make you good at debugging. If you are still learning how to program, don’t let the fancy tools from Visual Studio blind you, try to debug the hard way (that’s how I first learned to debug, using printf statements in Notepad++). Still, knowing the fancy tools is great, let’s take a look at them.
I’ve decided to divide the content of the post in two categories, the first one about how to find more information about what is happening and the second one about how to save time while debugging.
Contents
- Getting information (What’s happening?)
- Breakpoints
- Conditional Breakpoints
- Data breakpoints
- Simplify the code (Delete code)
- Time savers (How can I loose less time while debugging?)
- Move the cursor up to run some function again
- Change variables through debugger
- Use static variables to customize execution
- Stepping through the code (Alt+Shift+F11)
- Pen and Paper
Getting information
Breakpoints
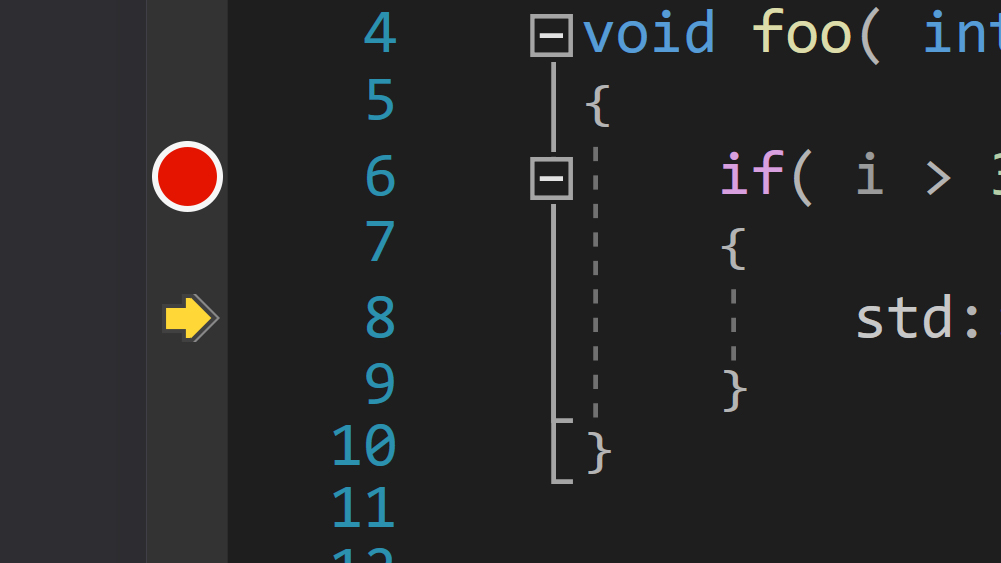
The most typical debugging technique, everyone knows how to put one of these. The main point to consider is where is the best place to put it, where can you get as much information as you can?
Conditional Breakpoints
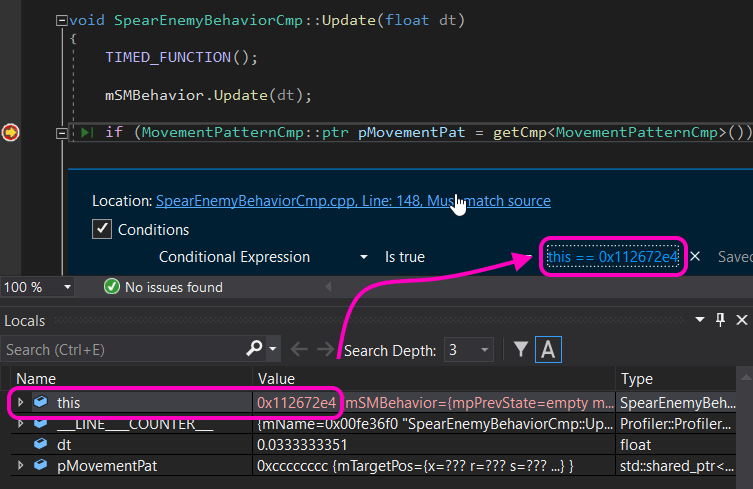
Conditional breakpoints are like breakpoints in steroids, they allow us to break the code in very specific cases by setting any condition we want.
Here you can see how they are set up and some ways in which I set them up:

Data breakpoints
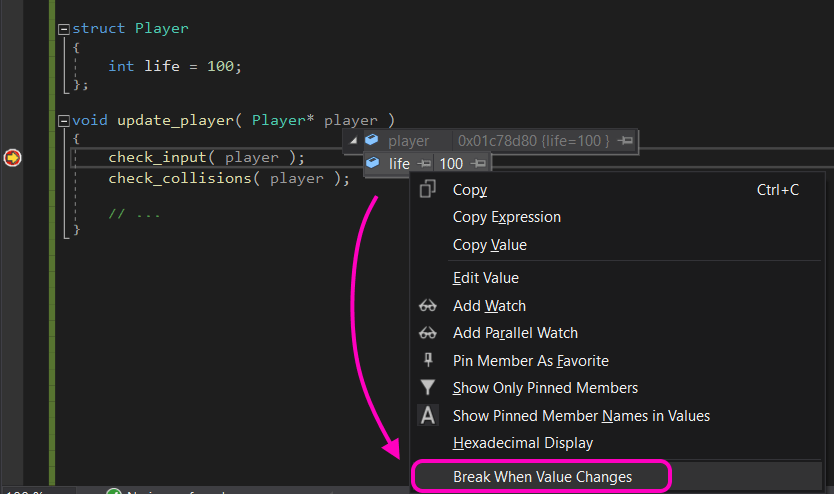
Data breakpoints are triggered when the value stored at some specific address in memory changes.
This is very useful when you don’t know where a value comes from, in this case I stop the execution in the last place where the “correct” value is set or just after the variable is created and enable the data breakpoint in it, then I press F5 (continue execution) and Voila! The program is stopped exactly in the code that is changing the variable.
Debug bad pointers with Data Breakpoints
When we are accessing to garbage and we don’t know why/where that object was deleted, we can place a data breakpoint in one of the objects variables to find the place where the memory is freed. In debug builds, when memory is freed the OS (or custom memory manager if your app is using one) writes some custom pattern (i.e. Microsofts HeapFree function writes 0xFEFEFEFE). We can set a data breakpoint in a variable of the object so that the breakpoint is triggered when the object is deallocated. This is what happens:
- Object or memory is passed to delete, free or your custom memory management function.
- Memory is freed.
- Debug pattern is freed <- at this point the memory where the data breakpoint is will change.
- The data breakpoint is triggered.
Here’s a sample code, imagine that we don’t know where the deletion of the object happens, that’s the line we want to find using a data breakpoint:
struct Object
{
	int life = 0;
};

void free_object( Object* object )
{
	delete object;
}

Object* make_object()
{
	Object* obj = new Object;
	return obj;
}

void game_update()
{
	Object* obj = make_object();

	// update obj...
	// ...

	// this is the place we are looking for,
	// but we don't know where it is (yet)
	free_object( obj );
}
The next gif shows how a data breakpoint is used in this code to break the execution at the function free_object:
Simplify the code (Delete code)
When the code we are working with is complicated we should try to simplify it as much as possible. There are two main reasons for this:
- Less code is executed: Narrows down the amount of code we need to deal with to find the problem, less code to debug.
- Less code on screen: by deleting code we create a simpler environment, allowing us to have better focus on the problem we have at hand.
“Deleted code is debugged code.”
Jeff Sickel
There are three ways we can approach code simplification:
* Commenting code: Code is not compiled any more and we are still able to bring it back if we find out we need it to debug properly.
The problem with this is that commented code has a single color (usually green), which makes it harder to read. Additionally, if we comment several lines of code, it will be harder to uncomment them if needed (either change all lines or remove the beginning and end of a block comment ( /* example */ ). On top of that, some editors allow you to collapse comments, if a multi-line comment is collapsed we don’t know right the way if is a real comment or code that was commented out.
* Preprocessor directives: This one is similar to commenting code but solves the caveats. Code still has its color, we can still read it properly. Enabling/Disabling multiple lines can be done with a simple change (This is something I learned from Casey Muratori in Handmade Hero).
void complex_function()
{
	// code...

#if 0 // set to 1 to enable the code
	// Several lines
	// of code
	// where we think
	// the problem is.
#endif

	// more code...
}
Additionally, we are able to implement alternative code and switch between it with a single change:
void complex_function()
{
	// code...

#if 0
	// Several lines
	// of code
	// where we think
	// the problem is.
#else
	// Some alternative implementation
	// to previous lines.
#endif

	// more code...
}
* Deleting code: It removes it completely from our screen and it makes it easier to debug the remaining code. The caveats of deleting code is that is harder to bring it back if we realize we need it. This is why I only delete code if I’m sure is not part of the problem (or needed to debug it), first I wrap it with a preprocessor directive, make sure that is not needed and if I think is better to delete it completely I do it.
Time savers
I’m always looking for ways to save up few seconds from actions I perform repeatedly during the day, those few seconds end up adding up to minutes of wasted time. One of those actions is recompiling and running the project, each time I have to do it I’m loosing some precious time and sometimes while waiting for it I get distracted and by the time the program runs again I don’t even remember what I was going to check.
Here are some tricks I use to avoid wasting those few seconds less often while I’m debugging:
Move the cursor up to run some function again
Moving the cursor to repeat some previous steps can help debugging as you can step in several times through the same code to see where exactly the error happens.
While using this method I found out that code that was well designed was easier to debug, I ended up learning how to write better code. For example:
* Bad design: If the function you are relying on changes the state of an object, the next time you call the function the state might change again (or the code won’t follow the same path). This type of code is harder to understand and to debug. If you move the arrow up and run this kind of function again, it will have a different outcome each time (as it constantly changes the state of the object).
* Good design: following a data-oriented approach, creating standalone (global) functions and changing the state only at the very end of the operation. This way you can run multiple times the same code and expect the same outcome (making sure the last step where data is set is not executed). Additionally, this type of code is easier to understand and easier to parallelize.
Note that the function compute_delta_movement takes the speed parameter and that the delta movement is applied in the update function, instead of creating a function update_movement that would do everything: read the speed parameter, compute the delta and apply it to the translation variable.
Change variables through debugger
Changing variables through debugger is a good way to check how the code behaves in different scenarios without having to update the code, recompile it and wait until the application/game loads all the data again.
Use static variables to customize execution
With static variables and the ability to change them through the debugger we can achieve the same result as using preprocessor directives. In this way we are able to perform changes in our logic, without having to recompile and reload all the data.
void complex_function()
{
	// code...

	static bool s_old_approach = false;
	if (s_old_approach)
	{
		// Several lines
		// of code
		// where we think
		// the problem is.
	}
	else
	{
		// Some alternative implementation
		// to previous lines.
	}

	// more code...
}
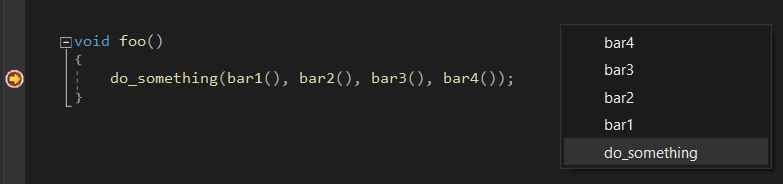
Stepping through the code (Alt+Shift+F11)
Using F11 while debugging executes one step in code. The problem is that when you have several statements in the same line and you want to get to the last one it becomes a nightmare (if you are used to debug in Visual Stdio you probably hate this process. Did you know that using Alt+Shift+F11 you can select to step to some specific call directly? In this way you can skip all calls and go directly to the last one (or some intermediate one).
Pen and Paper
- Draw pictures with what our code does (i.e. linked list, binary search tree, math vectors…)
- List the problems that might be causing the bug, then check them out as you verify that is not the issue. This way you won’t doubt if you already checked one case or not.
Stop for a moment and think of all the things that could create the current problem and write them down in paper (or some .txt file). Then check each of the items on the list and cross out the ones I already checked.
Don’t let the tools blind you
Debugging can become really hard, knowing the tricks I mentioned in this post is helpful, but the real challenge comes from the way you use them in each case. That’s when you become good at debugging, when you develop a thinking process that allows you to combine all the tools in order to find out the problem.
When I was learning to program at DigiPen I debugged using jut text in the console, I think that gave me the foundation I needed. Latter I had to squeeze my mind to debug graphics code using just colors in the screen, which was very frustrating and fun at the same time.
Don’t let the tools blind you, I think that the best way to develop the real debugging skills we need to set these tools aside. Learn the hard way so that when we face hard to debug problems we can find original debugging techniques.
I hope you find these tricks helpful while debugging your code. If you have some other that I didn’t mention, please let me know in the comments, every day is a good day to learn something new 🙂

Leave a comment